
I had the chance to serve as both producer and 2D animator on my capstone film, Bushitoad, during 2022-23. This hybrid film featured the main character, Toad, in 3D with 2D facial expressions while the secondary character, Lily, was entirely 2D. The backgrounds also combined 2D and 3D elements. The extent of our hybrid nature presented numerous production challenges as we balanced both pipelines to meet our deadlines. To manage our schedule, we utilized ShotGrid (Autodesk Flow Production Tracking) alongside Google Sheets.
Here's a look at our Pre-production schedule I created in Google Sheets. Making a proof of concept gave us a sense of how complex our pipeline would be and what measures I would have to take as a producer to reduce the possibility of confusion and miscommunication.

Here's some of our preproduction schedule. A simple gantt chart was our starting point...

This was our schedule for our proof of concept. Here we began color coding different departments.
Here's some of our preproduction schedule. A simple gantt chart was our starting point...

The final version of our pipeline. Click through to see each section zoomed in.

The key to our pre-production workflow is communication. I made sure to make note of each time a department needed approval from another before continuing.

This was the step that required the most trial and error. Initially we only planned on using After Effects for our compositing, but because we required more control, we switched to Nuke and DaVinci Resolve. Additionally, to create the painterly effects on our animations, and to help flatten-out the 3D assets, we used EB Synth.
The final version of our pipeline. Click through to see each section zoomed in.
After we wrapped Preproduction, I analyzed the trials and errors of our proof of concept: identifying underutilized departments, overworked teams, instances of falling behind schedule, and times when we were ahead. I also noted which tasks could occur simultaneously and which were interdependent. I then compiled this information into a flow chart to help visualize our process. This chart went through six versions before we found our ideal workflow!
(Click to expand)
I familiarized myself with Shotgrid to enhance our scheduling management. It offered us way more functionality than Google Sheets, including the ability to create templates for various assets and allowing team leads to give comments and feedback on submissions.

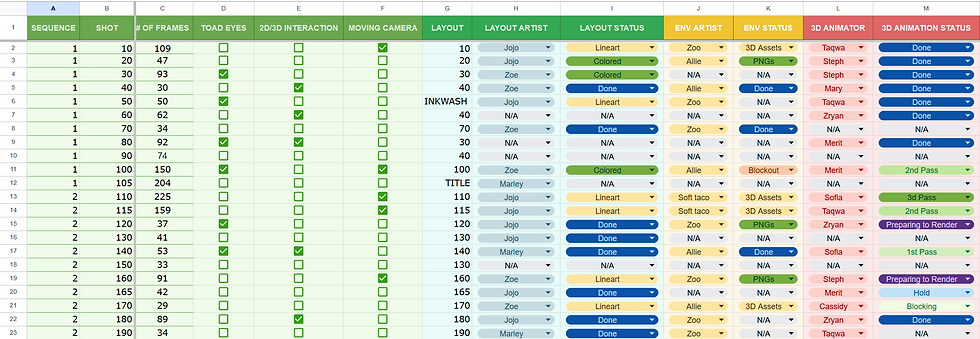
The left side of our shotlist. It was important that I made it clear which shots had camera movements, direct 2D/3D interaction or showed Toad's 2D expression, as these shots required a specialized workflow. (As seen in the pipeline flow chart)

The right side of our shotlist. These two screenshots only show 19 of our shots. We had 63 hybrid shots in total to keep track of!
The left side of our shotlist. It was important that I made it clear which shots had camera movements, direct 2D/3D interaction or showed Toad's 2D expression, as these shots required a specialized workflow. (As seen in the pipeline flow chart)
However, only our core team of 10 seniors had permissions to access the ShotGrid. For the benefit of our underclassmen helpers, we also maintained the Google Sheets schedule and shotlist.

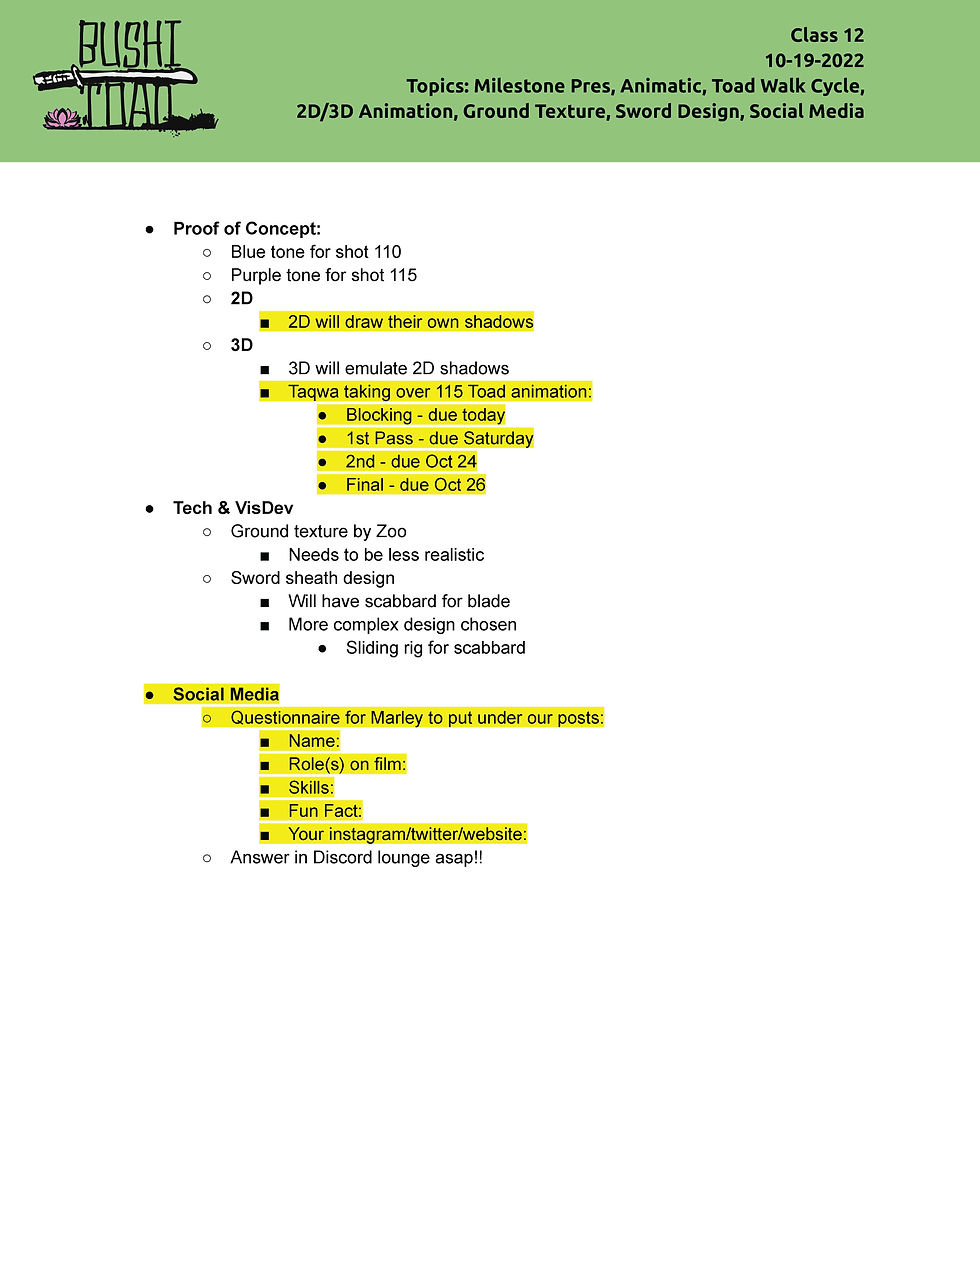
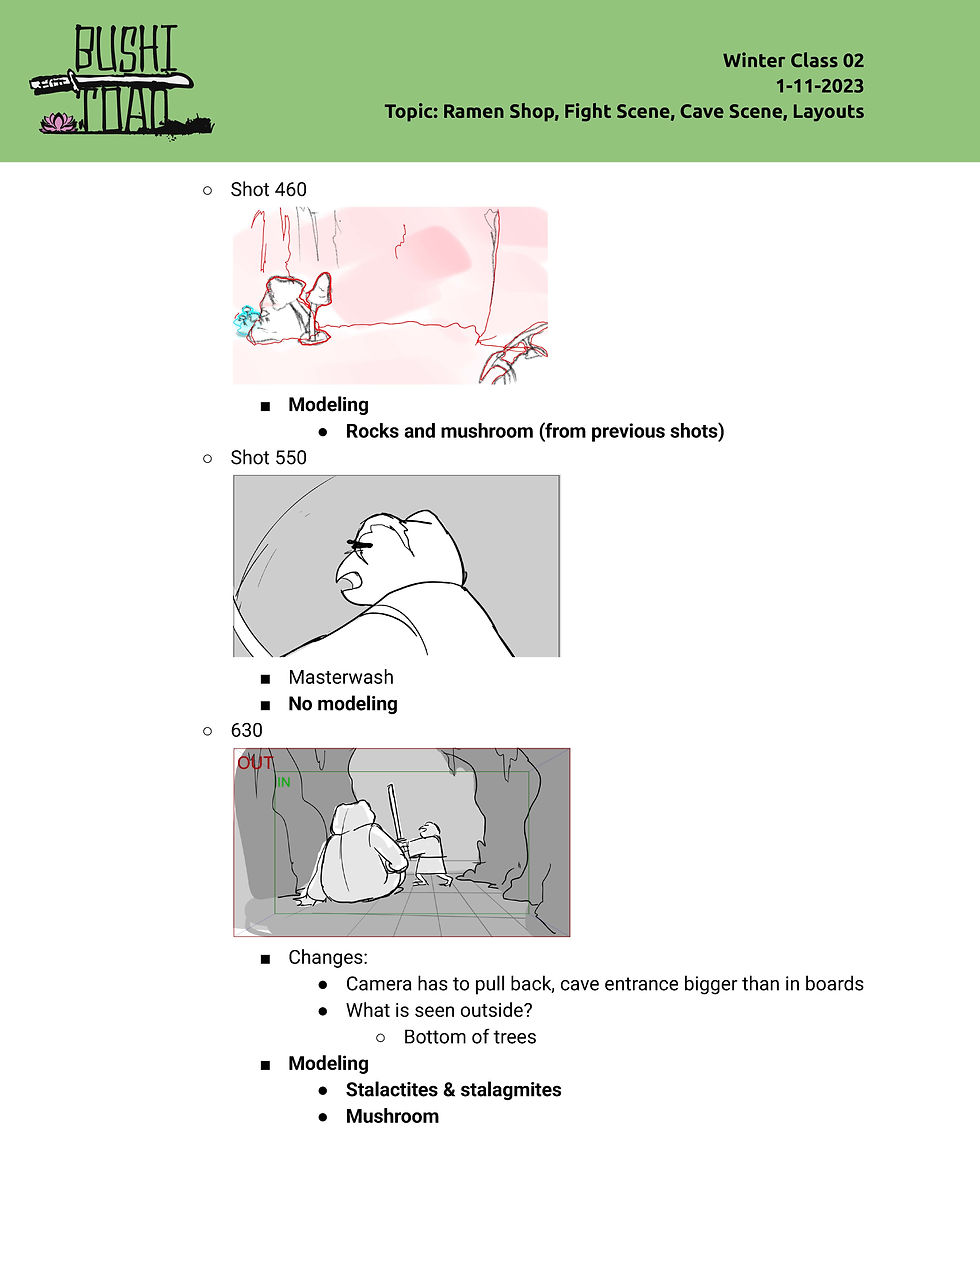
In addition to managing the schedule, I also took notes during daillies and meetings to send out to our team afterwards. Here's a look at a few of my notes.